
NEEAP 2.0: Misaligned with Malaysia's Climate Target?


Summary of NEEAP 2.0
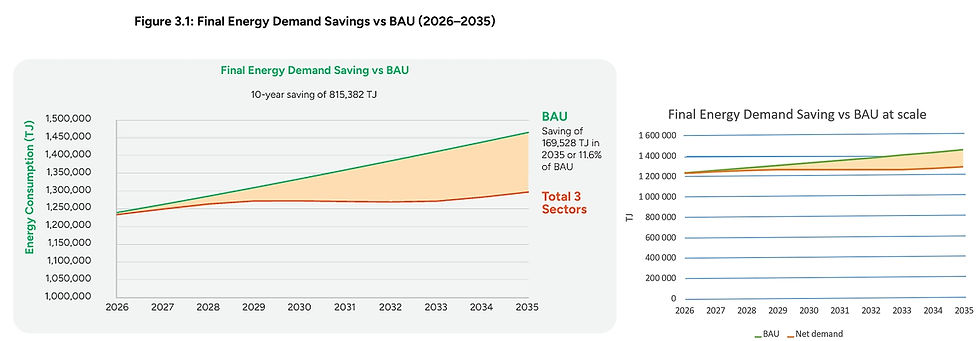
In the National Energy Efficiency Action Plan (NEEAP), Malaysia aims to improve its energy efficiency in pursuit of its net-zero carbon emissions target by 2050. The country’s targets are an 11.6% reduction in energy demand by 2035 compared with the Business as Usual (BAU) scenario, as well as 815,000 TJ in cumulative energy savings between 2026 and 2035. NEEAP 2.0 emphasises that the goal is not only to increase the use of green energy and reduce energy consumption, but also to promote a broader economic shift towards a more sustainable and future-oriented way of doing business across all sectors.
The main objective is therefore to reduce energy consumption through new regulations. The plan will also develop specific skills, financing mechanisms and, above all, private investment.
Why is Malaysia launching this new plan?
NEEAP 2.0 extends a policy that has been in place for several years. A first National Energy Efficiency Action Plan, which focused on electricity consumption in the industrial, commercial and domestic sectors sectors, was launched in 2016 to structure the country’s actions in this field.
This first plan created momentum and achieved an annual electricity saving of 5.78% compared to BAU. Its limitations, however, included the lack of targets for thermal energy and the absence of a sufficiently comprehensive mandatory regulatory framework, that called for an improvement of the NEEAP programme.
Malaysia therefore has several areas for improvement and plans to broaden the scope of its actions. These improvements will cover both electrical and thermal energy in the industrial, commercial and domestic sectors. These sectors accounted for approximately 47.6% of Malaysia’s final energy consumption in 2021, including electricity and direct fuel consumption.

The launch of the Energy Efficiency and Conservation Act 2024 (EECA 2024) on 1 January 2025 marks a significant change. The Act gives Malaysia a binding regulatory basis for energy management.
The country is therefore seeking to move from fragmented or voluntary initiatives towards a more integrated and legally regulated system.
Main pillars of NEEAP 2.0
The plan is based on four complementary pillars:
New regulations by implementing Energy-Saving Measures (ESMs) to meet sector-specific targets,
Training a skilled workforce focusing on energy efficiency (EE) systems,
Financing new funding mechanisms to support EE projects (grants, subsidies, etc.),
Intersectoral integration of EE practices, especially focusing on private sector mobilisation.
Main sectors of NEEAP 2.0
NEEAP 2.0 focuses its efforts on three sectors: industrial, commercial and domestic. Measures differ according to their uses and consumption profiles.
1) Industry, the main contributor
Industry plays a central role. It is expected to account for around 69% of the energy savings achieved over the period.
The plan targets an 11.9% reduction in industrial energy demand by 2035. To achieve this, measures cover five main areas:
Energy Management System (EnMS),
High-efficiency installations,
Efficient production processes,
Electrical equipment,
High-efficiency thermal equipment
2) Commercial buildings: measuring and improving actual performance
The commercial sector has the highest relative target, with a 13.2% reduction by 2035. The ESMs for this sector cover the following subjects:
Analyse energy consumption and improve the building envelope and lighting
Improve the efficiency of cooling and HVAC systems
Optimize building operation and control
3) Strengthening equipment standards in the domestic sector
The domestic sector has a reduction target of 8.7%. The main lever is the strengthening of Minimum Energy Performance Standards (MEPS). Requirements for appliances already covered by regulations are to be raised, particularly for air conditioners. Other categories of equipment will also be brought within the regulatory framework. These include domestic liquefied petroleum gas cooking stoves and electric water dispensers.
Progressive climate impact
Energy savings are expected to increase throughout the period. They represent 0.5% of the BAU scenario in 2026 and 11.6% in 2035. By then, annual energy savings are expected to reach 170,000 TJ.
1) Investments concentrated over ten years
Over the entire period, the government and private sector are expected to invest around RM36.6 billion. The distribution is highly uneven: only RM0.56 billion in public funding, compared with almost RM36.0 billion in private investment. The programme’s success therefore depends on the government’s ability to trigger this private financing, which is a major part of the plan.
2) Economic benefits exceeding the announced investments
Under the assumptions used, cumulative benefits (in this case financial savings) would reach RM85.2 billion. Once the total investment is subtracted from it, the balance stays positive with approximately RM48.6 billion over ten years. In other words, for each RM1 invested in energy efficiency, the benefit is RM1.33.
Energy cost savings are the main financial benefit. Consequently, substantial gains may come from lower production costs.
3) Employment and emissions
The implementation of the ESMs is also expected to create new jobs. The report mentions consultants, energy managers and energy auditors, as well as operations and maintenance personnel, installers and trainers. In total, 29,110 jobs could be created in the industrial and commercial sectors.
On the climate side, cumulative emission reductions are estimated at around 26.11 million MtCO₂e over ten years compared to BAU.
In 2035, avoided emissions would reach around 5.36 MtCO₂ for the year, representing a 5.07% reduction in 2035 compared with the reference trajectory used in the report. The cumulative reduction represents 2.6% of baseline emissions over the 10-year NEEAP period.
Commentary to the NEEAP 2.0
NEEAP 2.0 clearly shows Malaysia’s intention to strengthen its energy responsibility by improving several areas of action in parallel. The new plan seeks to adopt energy efficiency policies inspired by Thailand, Singapore, Japan and Denmark. However, when comparing the principles and resources proposed in the NEEAP 2.0, several shortcomings are evident compared to the model countries.
Drawing Lessons from Japan, Denmark and Thailand
NEEAP 2.0 sets an energy-saving target of 11.6% by 2035 compared with the business-as-usual scenario. This figure must be put into context before being compared with the "model countries" listed in the NEEAP.
The Malaysian scope only covers the industrial, commercial and domestic sectors. Some of the other nations also include transport, agriculture or other uses of energy. The periods and indicators also differ. It is therefore necessary to treat the data from Japan, Denmark and Thailand in order to bring about a fair comparison to the NEEAP 2.0 scope of Malaysia.
Most countries use energy intensity to show their “reduction” in their energy-efficiency targets. This indicator is useful for measuring the amount of energy required to produce one unit of wealth, but it does not directly describe changes in absolute energy consumption. Dividing energy consumption by the year’s GDP has advantages that are easy to exploit when trying to show impressive “reduction” figures. When GDP grows faster than energy consumption, energy intensity falls even if total consumption continues to rise, as highlighted in our previous article about Malaysia's deceptive 45% carbon emission reduction target (link). A reduction in intensity therefore does not at all mean a reduction in the total amount of energy consumed. For the analysis that follows, changes in absolute energy consumption or demand will therefore be compared.
As the energy efficiency plans of the individual countries address different dimensions and sectors, harmonization is necessary to enable a meaningful comparison. For further details, please refer to the full article. Since the periods studied differ, a comparison on an annual basis is more relevant. The compound annual growth rate is used rather than simply dividing the total percentage change by the number of years.
Country | Time period of analysis | Average annualised change in energy consumption |
Japan | 17 years | -1.35% |
Malaysia | 9 years | +0.57% |
Denmark | 13 years | +0.64% |
Singapore | 9 years | +1.14% |
Thailand | 19 years | +1.98% |
NEEAP 2.0 therefore limits demand growth without forecasting an absolute decline. However, an absolute decline is necessary for meeting Malaysia’s target net zero greenhouse gas emission by 2050 (see the section “A climate contribution that depends on other policies” below). The three sectors covered would still increase by 5.2% between 2026 and 2035, or around 0.57% per year.
Education is important, but what is the specific plan?
Some of the levers presented as decisive in the model countries have limited visibility in the program. NEEAP 2.0’s diagnosis identifies a lack of awareness, even though the importance of this issue is emphasized. In international comparison, the countries examined notably have education and awareness policies.
Malaysia adopts this same idea through Communication, Education and Public Awareness (CEPA). CEPA appears as a cross-cutting element of the framework but is much less detailed than the technical measures. NEEAP 2.0 does not set any quantified national target for the number of people reached changes in behaviour or energy savings directly attributable to the campaigns.
The contrast is notable. The document repeatedly sees education and awareness as a component of the success of the model countries, then incorporates them into its own plan without assigning them a national outcome indicator or a clearly defined budget.
Putting targets into context
Many of the NEEAP targets can only be properly assessed through appropriate comparison and contextualization.
1) A particularly low level of public financial commitment
The gap between ambition and resources becomes very visible in the overall financing of the plan. NEEAP forecasts total investment of RM36.60 billion over ten years. The private sector is expected to provide approximately RM36.04 billion. Public funding amounts to only RM0.56 billion. This means that the government directly finances approximately 1.5% of expected investment.
Placed in the context of Malaysia’s nominal GDP of RM1.93 trillion in 2024, annual public funding represents only 0.0029% of GDP, which for context is a factor 10 lower than Thailand. This represents a rather low level of public commitment, and as such, it is questionable whether the government will succeed in attracting the projected billions of ringgits in private investment.

2) An unfavourable comparison with Thailand and Denmark
Malaysia’s public investment commitment is comparatively lower as a share of total investment than that of the reference countries. For details on the calculation methods and assumptions, please refer to the full version of the article. The criticism focuses on the RM0.56 billion committed by the government. NEEAP’s financial success depends heavily on the arrival of private investment, which is not guaranteed.

3) Public Spending Priorities: Energy Efficiency vs. Energy Subsidies
The limited public funding commitment for energy efficiency is dwarfed by the public fossil fuels subsidies. In June 2026, the Ministry of Finance estimated that the annual fossil fuel subsidies could approach RM40 billion. For comparison, the NEEAP’s average annual public funding of RM0.056 billion represents just 0.14% of estimated fossil fuel subsidies for year 2026.

The difference in scale may indicate a difference in the level of commitment. Interestingly, the NEEAP 2.0 documents explicitly points out that fossil fuel subsidies place a financial burden on the government, whereas the investments in energy efficiency do not, as they are a good investment. Yet, a factor 714 more public funds are spent on fossil fuel subsidies.
As a side note, implementing NEEAP 2.0 could also be beneficial, as lower energy consumption would reduce the amount of subsidized fuel required and, consequently, government spending on keeping fuel prices artificially low.
4) Misalignment with Malaysia's Climate Policy Target?
Malaysia's climate actions are set out in Malaysia’s third Nationally Determined Contribution (NDC 3.0), submitted in October 2025. NDC 3.0 outlines Malaysia’s pathway and approach to achieving net zero carbon emissions by 2050. According to NDC 3.0, the country expects its national greenhouse gas (GHG) emissions to peak between 2029 and 2034 and aims to achieve an absolute reduction of 15 to 30 million tonnes of CO₂e by 2035 compared with the peak level. This does not align with the NEEAP 2.0, which charts a continuous growth in energy consumption up until 2035 past the supposed peak period.

Admittedly, the NEEAP 2.0 only accounts for a subset of the national energy consumption. Nevertheless, the lack of a peak in the energy consumption projected by NEEAP 2.0 is indicative of a worrisome misalignment with the national net zero greenhouse gas emission target.
It is also worth noting that the presentation of CO₂ savings in NEEAP 2.0 is somewhat misleading (see above graph). The y-axis does not start at zero but at an unspecified value. As a result, the 5.07% reduction, for example, appears disproportionately large. However, the bar does not represent the total emissions in 2035, but only a fraction of them.
Looking at a complete and less distorted representation of the CO₂ emissions, with the y-axis starting at zero (graphed by us; see second graph), together with the corresponding reductions, it becomes even clearer how small the actual savings are. Another example of deceptive graphics is illustrated below. It is the gap between the two scenarios, showing the 11.6% reduction in energy compared to BAU. In the report, the y-axis does not begin at zero either, making the gap look substantial in terms of proportions. It is visually less significant when seen on a true scale, as graphed by us on the right.
5) Cumulative job figures to be treated with caution
NEEAP 2.0 highlights 29,110 new jobs in the industrial and commercial sectors. This figure corresponds to the sum of the annual job estimates over ten years with a maximum of 4,085 new jobs created in a single year. The report is short on details whether the year-by-year employment is for permanent jobs, or whether some are temporary. In other words, the question is whether the number of new jobs created 29,110 by year 2035 is overstated.
To put the job creation in context, in the second quarter of 2026, Malaysia had approximately 510,000 unemployed people, corresponding to an unemployment rate of 3.0%. Even at the projected peak of 4,085 jobs in 2030, the figure remains close to 0.8% of the current number of unemployed people.
In addition, between the second quarter of 2025 and the second quarter of 2026, the number of employed people in Malaysia increased by approximately 179,200. The 2,911 annual jobs would represent an order of magnitude equivalent to 1.6% of this increase. The effect on employment therefore remains relatively limited.
6) Weak penalties
To enforce the new “enforceable regulations”, penalties have been introduced. They are intended to be sufficient to change the behaviour of the actors concerned. On this point, the Malaysian framework raises a question of proportionality.
The main obligations come from EECA 2024 (Act 861), supplemented by the Energy Efficiency and Conservation Regulations 2024. The framework notably covers large energy consumers using at least 21,600 GJ over twelve consecutive months.
For several key offences, the maximum fine is RM20,000, or RM50,000 in some cases. However, Suruhanjaya Tenaga estimates that the 21,600 GJ threshold corresponds approximately to a minimum annual electricity bill of RM2.4 million or a minimum annual natural-gas bill of RM1 million. The maximum RM50,000 fine therefore represents at most approximately 2.1% of this minimum electricity bill, or 5% of the gas bill. The proportion obviously becomes very small for companies operating well above the regulatory threshold.
If the expected penalty remains too low compared with a company’s financial capacity or the cost of the necessary investments, non-compliance could become a simple manageable "cost of business" rather than an incentive to comply with the regulation.
Having entered into force on 1 January 2025, these penalties remain unchanged under NEEAP 2.0. The plan relies on the EECA as the regulatory foundation of its policy but does not announce any increase in these penalties. The new plan therefore strengthens its targets while retaining the same level of weak penalties as before its launch.
What does the NEEAP 2.0 leave out?
1) Data centres
In NEEAP 2.0, the section on Energy Audits (EA) briefly mentions which types of buildings are included in the commercial sector: “This sector will comprise office buildings, hotels, retail and hospitals but excludes data centres.” The importance of including data centres in the energy-saving plan becomes particularly clear when looking at the diagram above.

2) Social Cost of Carbon
Another aspect that is not elaborated on in NEEAP 2.0, and in fact is not even mentioned once, is the Social Cost of Carbon, or Social Cost of Greenhouse Gas (SC-GHG) emissions. The SC-GHG aims to quantify the monetary value of the impacts associated with emitting or avoiding a given amount of GHG. Avoided emissions therefore generate an economic benefit, while every additional ton of GHG emissions creates potential future economic costs. When conducting a cost-benefit analysis of a national policy plan such as NEEAP 2.0, it would therefore be appropriate to consider this factor.
The fact that the social cost of GHG emissions is not incorporated into NEEAP 2.0, or even mentioned, is particularly relevant when considering the comprehensiveness of its cost-benefit analysis. Although different studies and modelling approaches produce different estimates of the SC-GHG, these differences reflect uncertainty surrounding future climate damages, socioeconomic development and methodological assumptions rather than questioning if there is a social cost of GHG emissions.
To provide a simplified estimate of the potential monetary value of the emissions avoided through NEEAP 2.0, a constant value of USD 80/tCO₂e (RM327/tCO2e) (Rao et al., 2025) is assumed in the following calculations. According to NEEAP 2.0, the implementation of its measures is expected to avoid 26,000 ktCO₂ over the ten-year period. This corresponds to savings of approximately RM 8.54 billion of social cost of carbon emissions. This represents a considerable additional benefit when compared with the energy-cost savings estimated in the report, which amount to approximately RM 85.2 billion.
Even more significant, however, are the potential future costs associated with the emissions generated by the three sectors covered by NEEAP 2.0 over ten years. The estimated emissions of 1,000,000 ktCO₂ between 2026 and 2035 would correspond to approximately RM 327 billion when applying a social cost of RM 327/tCO₂e. This provides an indication of the potential magnitude of the future social costs associated with the emissions projected for these sectors over the ten-year period.
Burke et al. (2026) estimate that the social cost of GHG emissions may be substantially higher than previously assumed in studies and partially incorporated into financial assessments, reaching approximately USD 1,000 per tCO₂e (around RM 4,500 per tCO₂e). This is more than 12 times the value assumed in the calculations above.
Conclusion
Overall, NEEAP 2.0 represents a continuation of Malaysia’s energy efficiency policy and gives the country a clear framework. Its targets nevertheless remain relatively cautious, especially when compared with the ambitions and historical performance of the countries used as references. The plan also relies heavily on private investment, while direct public funding remains very limited. At the same time, several assumptions and calculation methods are not explained in enough detail to be easily reproduced or independently assessed, and some of the penalties may appear too low to act as a strong deterrent for the large energy consumers.
In summary, the limited energy efficiency targets of NEEAP 2.0 means that the energy consumption of Malaysia will keep increasing. This seems to be in misalignment with the national net zero greenhouse gas emission target by 2050.
The Malaysian Minister of Natural Resources and Environmental Sustainability, YB Arthur Joseph Kurup, recently talked about wanting “to fast track our transition towards a low carbon economy”. The NEEAP 2.0 should seek to match that ambition.
References:
Rao, T., Mustapa, S. I., Al-Amin, A. Q., et al. (2025). Modelling the social cost of carbon for Malaysia. Carbon Research, 4, Article 18. https://doi.org/10.1007/s44246-024-00182-5
Burke, M., Zahid, M., Diffenbaugh, N. S., & Hsiang, S. (2026). Quantifying climate loss and damage consistent with a social cost of carbon. Nature, 651, 959–966. https://doi.org/10.1038/s41586-026-10272-6
NEEAP 2.0 review report link: https://drive.google.com/file/d/1X3t-vYeSgcrVdvCN7ooaeh3JHrObDDK1/view?usp=sharing


Comments