Troubleshooting Thermal Comfort Issues at Air Conditioned Link Bridge
- Ir. Khim Bok Tan

- Feb 14, 2022
- 3 min read
The Issue:

We were approached by the Building Management team of this particular building because they have been facing a continuous problem whereby the air conditioning system serving the total enclosed link bridge was not able to keep the indoor temperature within acceptable thermal comfort range on most days, with the exception of rainy days or after the sun has set. Suspecting that the fully glazed façade was the culprit due to excessive solar heat gains, the Building Management had already gone through the exercise of installing good quality heat rejecting tint film on all the external glazing. Unfortunately this did not solve the problem. The Building Management team had decided that the solution would be to introduce additional cooling capacity by adding additional air conditioning split units and sought our assistance to size the appropriate additional cooling required.
This was indeed a scope we could offer and we would be able to quite accurately estimate the peak cooling demand using the IES Virtual Environment dynamic energy simulation software.
Our Approach:
Increasing cooling capacity tends to be the solution that many would adopt when faced with a similar scenario where the existing air conditioning equipment is not able to remove sufficient heat loads to achieve desired indoor temperatures. However, we felt that it would be best to spend a bit of time and effort first investigating the root cause of the problem before adding capacity – which would be an expensive solution both in terms of initial cost, but also the additional electricity required to run these added capacity.
We adopted the following approach:
Carried out measurements of the space temperature, supply air temperature and return air temperature over 1 week duration
Compiled information on the as-built specifications of the glazing, roof, walls, insulation as well as the air conditioning units.
Created an energy model in IES VE to closely match the existing as-built conditions and local weather
Performed an hour-by-hour dynamic energy, cooling demand and indoor conditions simulation
Compared results of simulations against measured data
Visual site investigation to compare as-built drawings against actual site conditions

Our Findings:
Measurements vs Simulations:
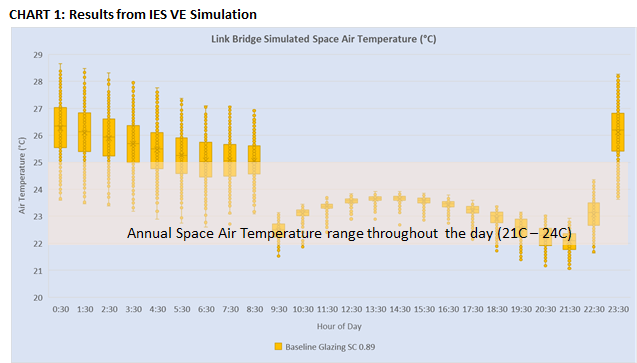
The graphs below show the comparison between our measured values vs the results extracted from our calibrated energy simulations


Our simulation result shows that the existing installed AC capacity should have no problem maintaining the space temperature between 21C to 24C throughout the entire year during operating hours.
However, the measured conditions shows that this is not happening. The measured space air temperature range is very large, from as low as 21C (in the evenings and night) to as high as 31C in the afternoon. This shows that the cooling system is incapable of maintaining the space temperature within the targeted range between 23-25C
Our computer simulations shows that the current 4 numbers of 28kW cooling capacity FCU should have no problems maintaining the space below 24C throughout the whole year.
The fact that the measured space temperature is much higher indicates that:
There may be possible external air leakage into this space that is not accounted for.
The AC units are not providing the cooling capacity it is rated for
The AC units is supplying a much lower supply air flowrate than the design drawings indicate.
Since the simulations could not match the measured temperatures, a more detailed site inspection was carried out at the Link Bridge to reconfirm if there is any obvious signs where the simulation could be different from what is actually happening in reality.
Site Inspection Findings
1. Link Bridge Ceiling is space is not completely isolated from the adjacent Shared Entry space

2. Supply Air Diffuser connection is using flexible ducting with sharp bends

Our Recommendations:
Based on our simulations, we can conclude that the design capacity for the FCUs installed at the Link Bridge is more than sufficient to cool the Link Bridge.
Therefore, our recommendations are (to be carried out in the sequence listed):
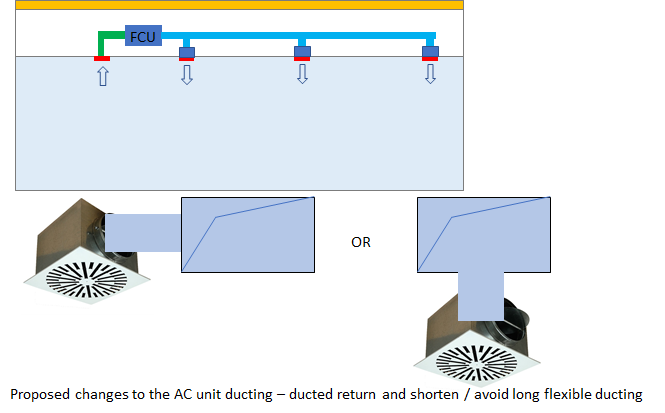
Install a return air grille close to the return for each FCU and directly duct the return into the FCU. This will avoid having to seal up the opening between the Shared Entry & Link Bridge
Connect Supply Air diffusers directly to the rigid ducting using rigid ducting instead of flexible ducting. Supply air grilles to be installed with plenum boxes.
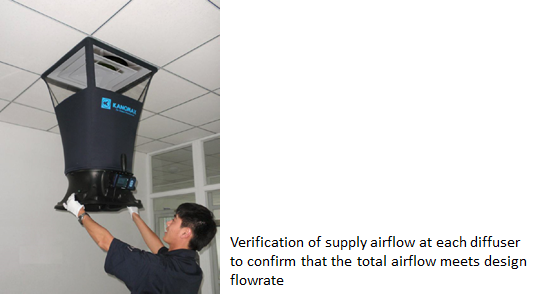
After item 1 and 2 has been carried out – contractor shall carry out airflow verification of all supply air diffusers using flow measurement hoods to verify the actual supply airflow compared to the design airflow. This verification step is often neglected in many installations.


By adopting the step-by-step audit and simulations approach to this issue, rather than directly assuming that the existing capacity was insufficient, we were able to provide a solution to the owner that avoided costly upgrading of the existing air conditioners.


Comments